For the purposes of this module and its exercises, we will be using the 2025 Queensland Tide Tables published by the Queensland Government. You should download this pdf and use it as the tide reference with this module.
Secondary ports are those for which daily predictions are not provided in the Queensland Tide Tables. These locations are grouped and associated to the adjacent standard port with a similar tidal pattern. Data sufficient for calculating their times and heights is supplied following the standard port prediction tables.
Tidal Levels – A list of tidal levels referred to Queensland Port Datum for standard ports and selected secondary places is given in the following tables:
Semidiurnal Tide Planes – refers to a tide which has a period or cycle of approximately half of one tidal day (about 12.5 hours). Semidiurnal tides usually have two high and two low tides each day. The tides at Brisbane Bar are a typical example of semidiurnal tides.
Diurnal Tide Planes – refers to a tide which has a period or cycle of approximately one tidal day (about 25 hours). Diurnal tides usually have one high and one low tide each day. The tides at Karumba are a typical example of diurnal tides.
In addition, the tables for semidiurnal and diurnal tidal planes provide the factors necessary to calculate tidal predictions at the selected secondary places (referred to Queensland Port Datum at each secondary place) from the tidal predictions of the standard ports.
Find the required locality in the Semidiurnal Tidal Planes table or the Diurnal Tidal Planes table using the 2025 Queensland Tide Tables and note its standard port:
Time of High Water
Note the time difference in column 1;
Add or subtract (as indicated by + or -) this time difference to the predicted time of high water at the standard port.
Time of Low Water
Note the time difference in column 2;
Add or subtract (as indicated by + or -) this time difference to the predicted time of low water at the standard port. The result is the approximate time of the tide at the required locality.
Height of High Water
Find the height of the predicted high water at the standard port;
Multiply the height by the ratio in column 8. If Ratio is blank, use value for Standard Port which in this case is Brisbane Bar with Ratio of 1.00.
Add or subtract (as indicated by the + or -) the constant in column 9. If Constant is blank, use value for Standard Port which in this case is Brisbane Bar with Constant of 0.
Height of Low Water
Find the height of the predicted low water at the standard port;
Multiply the height by the ratio in column 8. If Ratio is blank, use value for Standard Port which in this case is Brisbane Bar with Ratio of 1.00.
Add or subtract (as indicated by the + or -) the constant in column 9. If Constant is blank, use value for Standard Port which in this case is Brisbane Bar with Constant of 0.
The result is the approximate height of tide at the required locality.
Once you have calculated the HW and LW times and heights for your secondary port, you can use the Standard Tidal Curve exactly as described in the previous module to find the tide height at any intermediate time.
Example Tide Calculation for Secondary Ports
Standard Port Tides
Following is an example extract of Tide times and levels on 16th of April 2025 for Brisbane Bar which is our Standard Port in this example. :
Description
Time
Metres from (LAT)
Low Water (LW)
05:32
0.73m
High Water (HW)
11:04
1.88m
Low Water (LW)
17:12
0.56m
High Water (HW)
23:41
2.33m
Secondary Port Differences
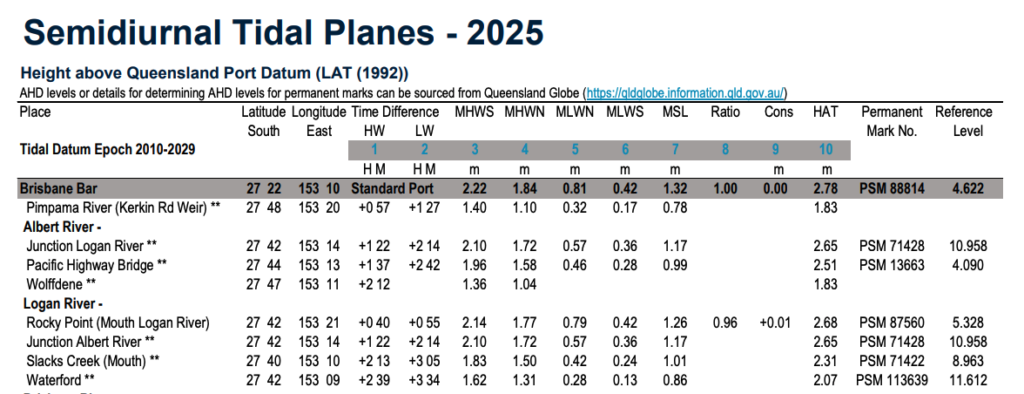
We are going find the tide levels for Rocky Point which is our Secondary Port. Time and height differences derived from columns using the screen shot above of Semidiurnal Tidal Planes for Brisbane Bar and extracted to below table:
Time difference High water (Column 1)
+0:40
Time difference Low water (Column 2)
+0:55
Ratio (Column 8)
0.96
Constant (Column 9)
+0.01
Predicted HIGH water at Secondary Port (Rocky Point)
Predicted High Water at Brisbane Bar (Standard Port)
1.88m at 11:04
Time of High Water at Rocky Point (Secondary Port)
11:04 + 0:40 = 11:44
Height of High Water at Rocky Point ((HW * Ratio) + Constant)
(1.88m * 0.96) + 0.01 = 1.81m + 0.01 = 1.82m
Predicted LOW water at Secondary Port (Rocky Point)
Predicted Low Water at Brisbane Bar (Standard Port)
0.73m at 05:32
Time of Low Water at Rocky Point (Secondary Port)
05:32 + 0:55 = 06:27
Height of Low Water at Rocky Point ((LW * Ratio) + Constant)
(0.73m * 0.96) + 0.01 = 0.71m + 0.01 = 0.72m
Calculating Tide Range for Secondary Port
The range of the tide is the difference between the height of high water and the next succeeding or last preceding low water for Rocky Point (Secondary Port). Using above example to find the tide height difference (Tide Range) for 16th of April 2025 for 09:30. subtract the low water from high water to get the range:
High Water
1.82m
Low Water
0.72m
Range (Height Difference)
1.10m
Calculating intermediate height
Continuing with above example, we need to find tidal height at 09:30 taking following steps:
Find time difference from High Water: 11:44 (HW) – 09:30 (Desired Time) = 2 hours and 14 minutes before high water.
Tidal Range: 1.82m (HW) – 0.72m (LW) = 1.10m
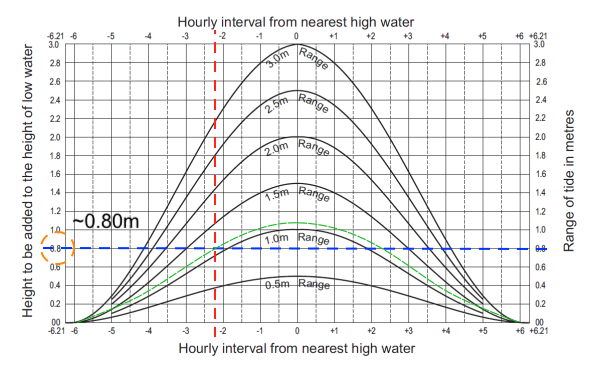
Using the 3m Standard Tidal Curve graph, find the 2 hours 14 minutes mark before high water on the horizontal axis (Red line on below graph).
Follow the line up to the projected 1.10m tidal curve and read the corresponding height on the vertical axis (Blue line on below graph).
In this scenario, the curve shows the height to be added to the low water is approximately 0.80m
Calculate Actual Height
Height at 09:30 am = Low Water Height + Curve Height
Result: 0.72m + 0.80m = 1.52 m.
At 09:30, the tide height is approximately 1.52 meters above the Lowest Astronomical Tide (LAT)
Progress Check
Complete the exercises in each tab to check your progress for Secondary Ports. Please use the Queensland MSQ 2025 Tide Tables as the exclusive reference in all the exercises. Any tide times should be formatted as HH:mm (Example: 09:35). This would typically show as 0935 in the Queensland Tide tables.
{"selectedComponent":"tideform","tabGroup":"exercises_secondary","tideform_published":true,"tideform_description":"Calculate the height of tide for secondary port Innisfail (Mourilyan Harbour) on 4th of February 2025. ","tideform_tab_title":"Exercise 1 - Innisfail","tideform_show_secondary_port":true,"tideform_std_row1_time":"01:32","tideform_std_row1_height":"2.20","tideform_std_row2_time":"07:07","tideform_std_row2_height":"1.66","tideform_std_row3_time":"13:20","tideform_std_row3_height":"2.36","tideform_std_row4_time":"20:49","tideform_std_row4_height":"1.33","tideform_sec_row1_timediff":"+0:25","tideform_sec_row1_ratio":"0.98","tideform_sec_row1_constant":"-0.63","tideform_sec_row2_timediff":"+0:55","tideform_sec_row2_ratio":"0.98","tideform_sec_row2_constant":"-0.63","tideform_sec_table2_row1_time":"01:57","tideform_sec_table2_row1_height":"1.53","tideform_sec_table2_row2_time":"08:02","tideform_sec_table2_row2_height":"1.00","tideform_sec_table2_row3_time":"13:45","tideform_sec_table2_row3_height":"1.68","tideform_sec_table2_row4_time":"21:44","tideform_sec_table2_row4_height":"0.67","tideform_show_tidal_range":false,"tideform_show_vessel_requirements":false,"tideform_show_low_water":false,"tideform_show_required_tide":false,"tideform_std_row1_tide":"HW","tideform_std_row2_tide":"LW","tideform_std_row3_tide":"HW","tideform_std_row4_tide":"LW","tideform_sec_row1_tide":"HW","tideform_sec_row2_tide":"LW","tideform_sec_table2_row1_tide":"HW","tideform_sec_table2_row2_tide":"LW","tideform_sec_table2_row3_tide":"HW","tideform_sec_table2_row4_tide":"LW","tideform_range_hw":"","tideform_range_lw":"","tideform_range_range":"","tideform_vessel_ukc":"","tideform_vessel_draught":"","tideform_vessel_total":"","tideform_vessel_charteddepth":"","tideform_vessel_requiredheight":"","tideform_lowwater_chartlat":"","tideform_lowwater_lw":"","tideform_lowwater_total":"","tideform_required_total":"","tideform_required_actuallw":"","tideform_required_tideheight":"","tideform_required_tidetime":"","tideform_show_tide_result":false,"tideform_show_tide_time":false,"tideform_tide_time_extrawater":"","tideform_tide_time_earliest":"","tideform_tide_result_tidetime":"","tideform_tide_result_timediff":"","tideform_tide_result_extra_height":"","tideform_tide_result_height":""}
{"selectedComponent":"tideform","tabGroup":"exercises_secondary","tideform_published":true,"tideform_description":"Calculate the height of tide for secondary port Cooktown (Cairns) on 16th of April 2025. \n\nAlso calculate the Tidal range for the secondary port at 18:05","tideform_tab_title":"Exercise 2 - Cooktown","tideform_show_secondary_port":true,"tideform_show_tidal_range":true,"tideform_std_row1_tide":"LW","tideform_std_row1_time":"04:24","tideform_std_row1_height":"1.66","tideform_std_row2_tide":"HW","tideform_std_row2_time":"09:39","tideform_std_row2_height":"2.12","tideform_std_row3_tide":"LW","tideform_std_row3_time":"16:12","tideform_std_row3_height":"1.08","tideform_std_row4_tide":"HW","tideform_std_row4_time":"22:55","tideform_std_row4_height":"2.46","tideform_sec_row1_timediff":"-0:02","tideform_sec_row1_ratio":"0.92","tideform_sec_row1_constant":"0.00","tideform_sec_row2_timediff":"+0:06","tideform_sec_table2_row1_tide":"LW","tideform_sec_table2_row1_time":"04:30","tideform_sec_table2_row1_height":"1.53","tideform_sec_table2_row2_tide":"HW","tideform_sec_table2_row2_time":"09:37","tideform_sec_table2_row2_height":"1.95","tideform_sec_table2_row3_tide":"LW","tideform_sec_table2_row3_time":"16:18","tideform_sec_table2_row3_height":"0.99","tideform_sec_table2_row4_tide":"HW","tideform_sec_table2_row4_time":"22:53","tideform_sec_table2_row4_height":"2.26","tideform_range_hw":"2.26","tideform_range_lw":"0.99","tideform_range_range":"1.27","tideform_show_vessel_requirements":false,"tideform_show_low_water":false,"tideform_show_required_tide":false,"tideform_sec_row1_tide":"HW","tideform_sec_row2_tide":"LW","tideform_sec_row2_ratio":"","tideform_sec_row2_constant":"","tideform_vessel_ukc":"","tideform_vessel_draught":"","tideform_vessel_total":"","tideform_vessel_charteddepth":"","tideform_vessel_requiredheight":"","tideform_lowwater_chartlat":"","tideform_lowwater_lw":"","tideform_lowwater_total":"","tideform_required_total":"","tideform_required_actuallw":"","tideform_required_tideheight":"","tideform_required_tidetime":"","tideform_show_tide_result":false,"tideform_show_tide_time":false,"tideform_tide_time_extrawater":"","tideform_tide_time_earliest":"","tideform_tide_result_tidetime":"","tideform_tide_result_timediff":"","tideform_tide_result_extra_height":"","tideform_tide_result_height":""}
{"selectedComponent":"tideform","tabGroup":"exercises_secondary","tideform_published":true,"tideform_description":"Calculate the height of tide for secondary port Abel Point (Shute Harbour) on 14th of October 2025. \n\nYou arrive at the secondary port at 07:35\n\nUsing the tidal curve, interpolate the extra water after low water and calculate tide height at arrival time.","tideform_tab_title":"Exercise 3 - Abel Point","tideform_show_secondary_port":true,"tideform_show_tidal_range":true,"tideform_std_row1_time":"05:37","tideform_std_row1_height":"2.32","tideform_std_row2_time":"11:15","tideform_std_row2_height":"0.97","tideform_std_row3_time":"17:59","tideform_std_row3_height":"3.48","tideform_std_row4_tide":"","tideform_sec_row1_timediff":"-0:07","tideform_sec_row1_ratio":"0.91","tideform_sec_row1_constant":"0.00","tideform_sec_row2_timediff":"-0:06","tideform_sec_table2_row1_time":"05:30","tideform_sec_table2_row1_height":"2.11","tideform_sec_table2_row2_time":"11:09","tideform_sec_table2_row2_height":"0.88","tideform_sec_table2_row3_time":"17:52","tideform_sec_table2_row3_height":"3.17","tideform_sec_table2_row4_tide":"","tideform_range_hw":"2.11","tideform_range_lw":"0.88","tideform_range_range":"1.23","tideform_show_tide_result":true,"tideform_tide_result_tidetime":"07:35","tideform_tide_result_timediff":"+02:05","tideform_tide_result_extra_height":"0.75","tideform_tide_result_height":"1.63","tideform_show_vessel_requirements":false,"tideform_show_low_water":false,"tideform_show_required_tide":false,"tideform_std_row1_tide":"HW","tideform_std_row2_tide":"LW","tideform_std_row3_tide":"HW","tideform_std_row4_time":"","tideform_std_row4_height":"","tideform_sec_row1_tide":"HW","tideform_sec_row2_tide":"LW","tideform_sec_row2_ratio":"","tideform_sec_row2_constant":"","tideform_sec_table2_row1_tide":"HW","tideform_sec_table2_row2_tide":"LW","tideform_sec_table2_row3_tide":"HW","tideform_sec_table2_row4_time":"","tideform_sec_table2_row4_height":"","tideform_vessel_ukc":"","tideform_vessel_draught":"","tideform_vessel_total":"","tideform_vessel_charteddepth":"","tideform_vessel_requiredheight":"","tideform_lowwater_chartlat":"","tideform_lowwater_lw":"","tideform_lowwater_total":"","tideform_required_total":"","tideform_required_actuallw":"","tideform_required_tideheight":"","tideform_required_tidetime":"","tideform_show_tide_time":false,"tideform_tide_time_extrawater":"","tideform_tide_time_earliest":""}