
For the purposes of this module and its exercises, we will be using the 2025 Queensland Tide Tables published by the Queensland Government. You should download this pdf and use it as the tide reference with this module.
Standard Ports
Standard ports are those provided as daily tables of the predicted times and heights of high and low waters. The tide times are referred to Australian Eastern Standard Time (AEST +1000) and the tide heights are referred to LAT datum. The 24-hour clock is used in the Time Tables. For example 06:00 is equivalent of 6am and 13:00 is the same as 1pm.
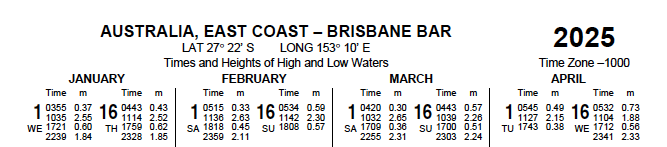
Following is an example extract of Tide Levels on 16th of April 2025 for Brisbane Bar:
Description |
Time |
Metres from (LAT) |
|---|---|---|
Low Water/Tide (LW) |
05:32 |
0.73m |
High Water/Tide (HW) |
11:04 |
1.88m |
Low Water/Tide (LW) |
17:12 |
0.56m |
High Water/Tide (HW) |
23:41 |
2.33m |
Calculating Tide Range
The range of the tide is the difference between the height of high water and the next succeeding or last preceding low water. Using above example to find the tide height difference (Tide Range) for 16th of April 2025 for 09:30. subtract the low water from high water to get the range:
High Water |
1.88m |
Low Water |
0.73m |
Range (Height Difference) |
1.15m |
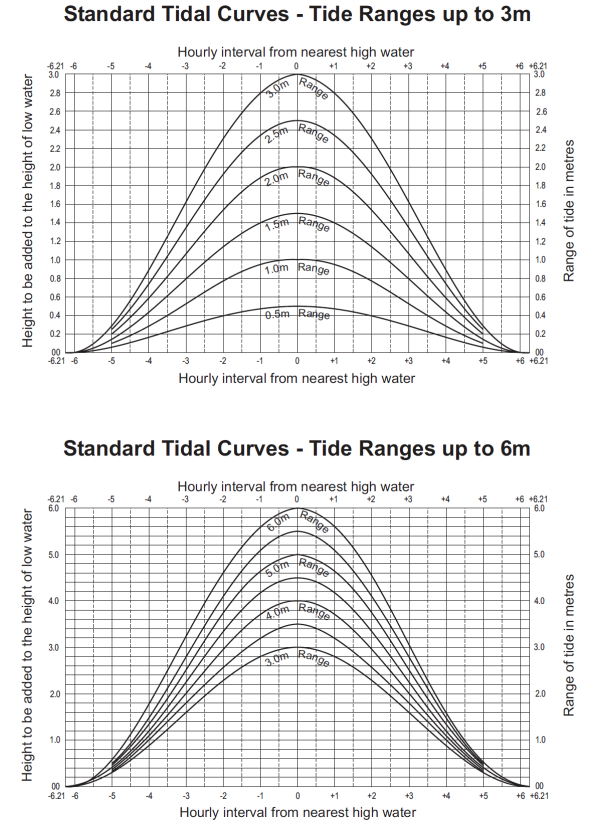
Standard Tidal Curves
Standard Tidal Curves are graphical tools used in maritime navigation to find the height of the tide at any time between high and low water, using data from tide tables for a “Standard Port” (like Brisbane Bar or Mackay). This is called an intermediate tidal height.
They feature time on the horizontal axis and height on the vertical, with a bell-shaped curve showing how tide height changes over the tidal cycle (usually ~12.4 hours) for both spring and neap tides, allowing navigators to determine available depths for vessels.
Following are Standard Tidal Curves from the 2025 Queensland Tide Tables used to calculate intermediate tide heights.
How They Work
- Get Standard Port Data: Obtain the predicted times and heights of High Water (HW) and Low Water (LW) for a Standard Port from a tide table.
- Determine Tidal Range: Calculate the difference between HW and LW height (the Range).
- Plot on the Curve: Use a plotter or straight edge to draw a line on the curve corresponding to your tidal range (e.g., 1.15m range).
- Find Time: Mark the time of High Water on the curve and count the hours (or fractions of hours) before or after it.
- Read the Height: Find your desired time on the curve, move across to the height scale to see the water level.
Key Components
- Time Axis: Shows hours before/after HW (e.g., -6 to +6 hours).
- Height Scale: Vertical scale showing water height (meters).
- Tidal Curve (Bell Curve): The curved line showing the rate of rise/fall; steeper at first, flatter near HW/LW.
Example use of the Standard Tidal Curve
Continuing with above example, we need to find tidal height at 09:30, chosen as a time between the LW at 05:32 and HW at 11:04, taking following steps:
- Find time difference from High Water: 11:04 (HW) – 09:30 (Desired Time) = 1 hour and 34 minutes before high water.
- Tidal Range: 1.88m (HW) – 0.73m (LW) = 1.15m
- Using the 3m Standard Tidal Curves graph, find the 1 hour 34 minutes mark before high water on the horizontal axis (Red line on below graph).
- Follow the line up to the projected 1.15m tidal curve (Green line on below graph) and read the corresponding height on the vertical axis (Blue line on below graph).
In this scenario, the curve shows the height to be added to the low water is approximately 0.95m
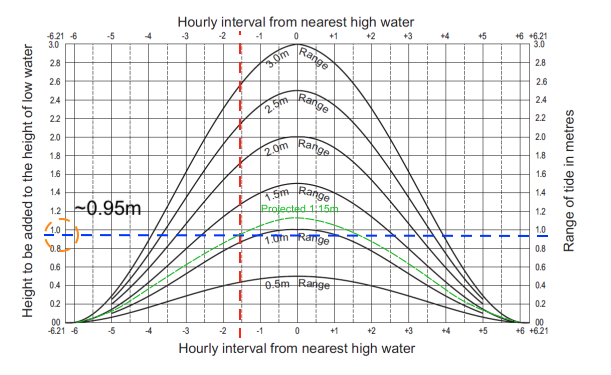
Calculate Actual Height
- Height at 09:30 am = Low Water Height + Curve Height
- Result: 0.73m + 0.95m = 1.68 m.
At 09:30, the tide height is approximately 1.68 meters above the Lowest Astronomical Tide (LAT)